Business Intelligence Solution to Improve Cash Conversion Cycle
Struggling to boost cash flow?
As a finance professional, there are 3 possible courses of actions you can take to improve cash flow:
- Focus on suppliers: Delay payments to them.
- Focus on inventory: Turn inventory into sales faster.
- Focus on sales: Receive payments more quickly.
To understand which of these directions is more suitable for their organization, many finance leaders turn to data for guidance.
However, many struggle with deriving insights from data:
“I can’t trust this data, it’s so inaccurate!”
If you’re also interested in becoming data-driven, here’s an example of a business intelligence solution helping you make informed decisions to improve the cash cycle.
Report for Improving Cash Cycle
Cash cycle = Days until the company converts cash spent on inventory into cash from sales. The shorter the cycle, the better.
There are three courses of action you can take to reduce this metric:
- Pay vendors later.
- Collect cash from sales faster.
- Reduce the time needed to turn inventory into sales.
Which approach is more suitable for your organisation? This report created in Power BI analyzes which of these 3 has the highest impact on cash flow.
Cash Conversion Cycle Report
The report works in the following way:
Data collection: Collect the following data about vendors: purchase dates, payment terms and actual payment dates. For every client, collect invoice dates and payment dates. For every product category, collect sales and inventory levels.
Data model: In the backend, it aggregates this data to calculate 3 distinct metrics:
- Average days required to pay vendors (days payable outstanding).
- Average days for payment from customers (days sales outstanding).
- Days required to turn inventory into sales (days sales of inventory).
Here is how you can use such a report:
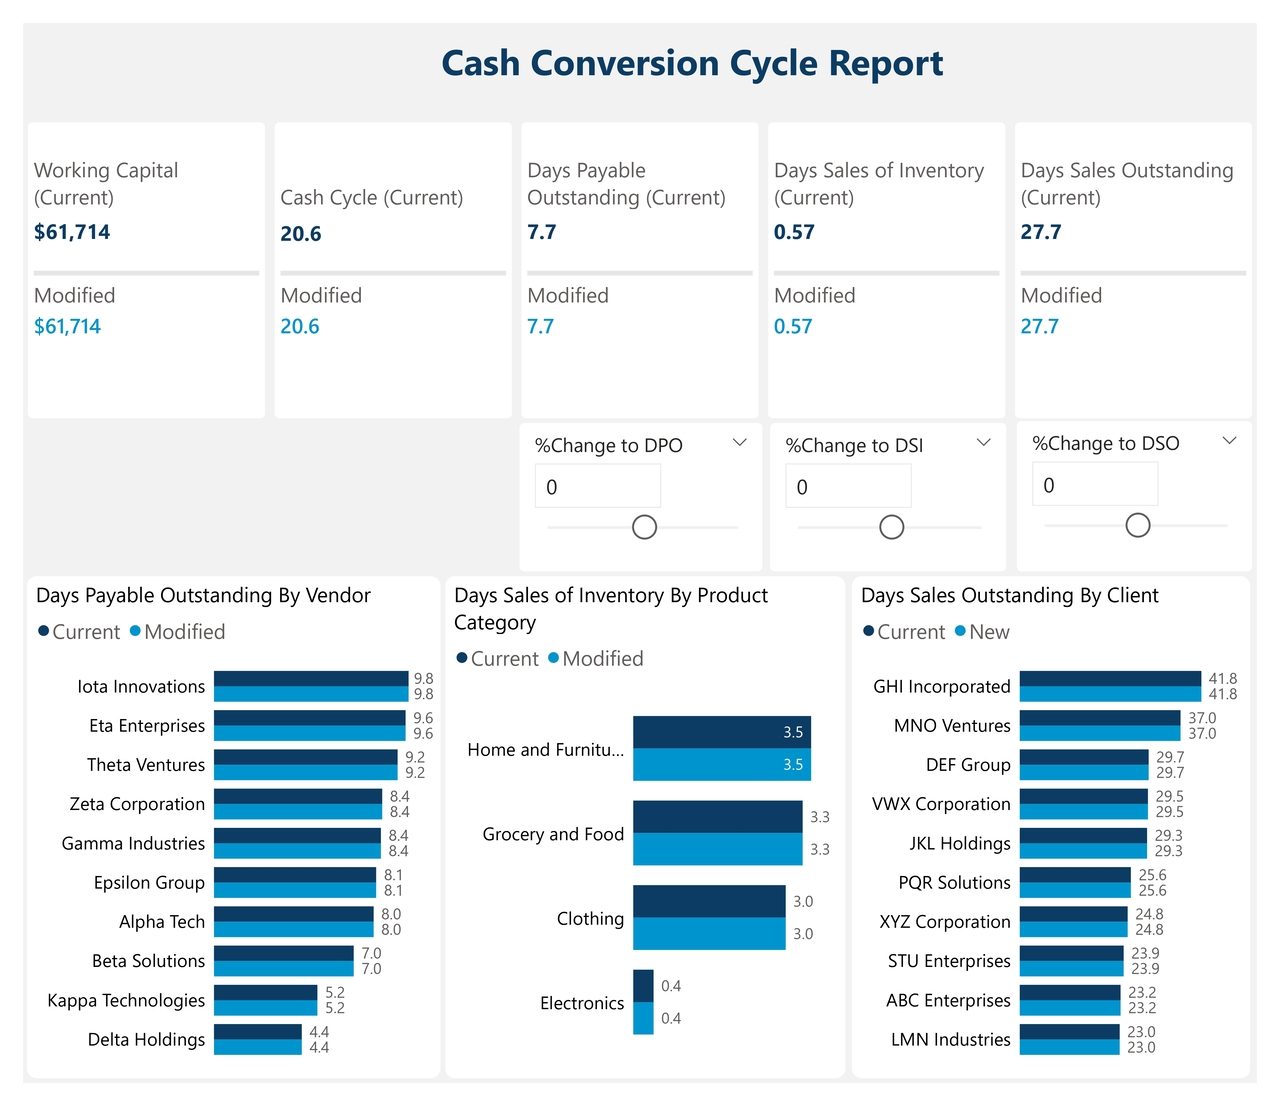
Cash Cycle Overview: The top cards show an overview of the cash cycle: The current working capital is $61,714. It takes the company 20.6 days to convert cash spent on inventory into cash from sales. Out of these 20.6 days, it takes the company 7.7 days to pay its vendors, 0.57 days to turn inventory into sales, and 27.7 days for customers to pay their orders.
Sensitivity Analysis: In the middle of the report, there are three parameters you can change: Days Payable Outstanding (DPO), Days Sales of Inventory (DSI), and Days Sales Outstanding (DSO). Changing one parameter simulates how a percentage change in that metric affects the cash flow. For example, increasing the days it takes to pay the vendors (DPO) by 5% will change the working capital from $61,714, the current value, to $60,558.
Key Drivers: Identify the key driver of cash flow by changing each of the three parameters and analyzing which parameter improves cash flow the most. In this dataset, the highest impact on cash flow is from Days Sales Outstanding. If customers pay the company 10% faster for their orders, the working capital would be reduced to $53,402.
This analysis, facilitated by finance analytics and Power BI, indicates that tightening the credit terms for customers would have the highest impact on improving cash flow. As a next step, you can offer early payment discounts to encourage your customers to pay invoices earlier.
Want faster, smarter insights from your data?
Book a quick 30-minute call to explore how I can support your organization’s goals.