Business Intelligence Solution to Improve Customer Experience
“How can we improve customer satisfaction with our brand?”
If you are also asking yourself this question, marketing analytics and tools like Power BI can provide excellent answers tailored to your specific organization.
However, many professionals struggle to gather insights from data:
“I’m drowning in excel; how can I make sense of all this data?”
They often say while battling with pivot tables.
If you’re also interested in becoming data-driven, here’s an example of a business intelligence solution to help you make informed decisions that increase customer satisfaction.
Report for Improving Customer Experience
An objective way to measure customer experience is by analyzing the service tickets created by customers. The volumes of these tickets, as well as how fast they are completed, help you detect potential inefficiencies: If you detect specific cases with a high volume that are taking a long time to complete, customers can potentially experience a lower satisfaction at that point.
What are the stumbling blocks that cause your customers to lose their way?
This report, created in Power BI, shows how business intelligence helps you answer these types of questions.
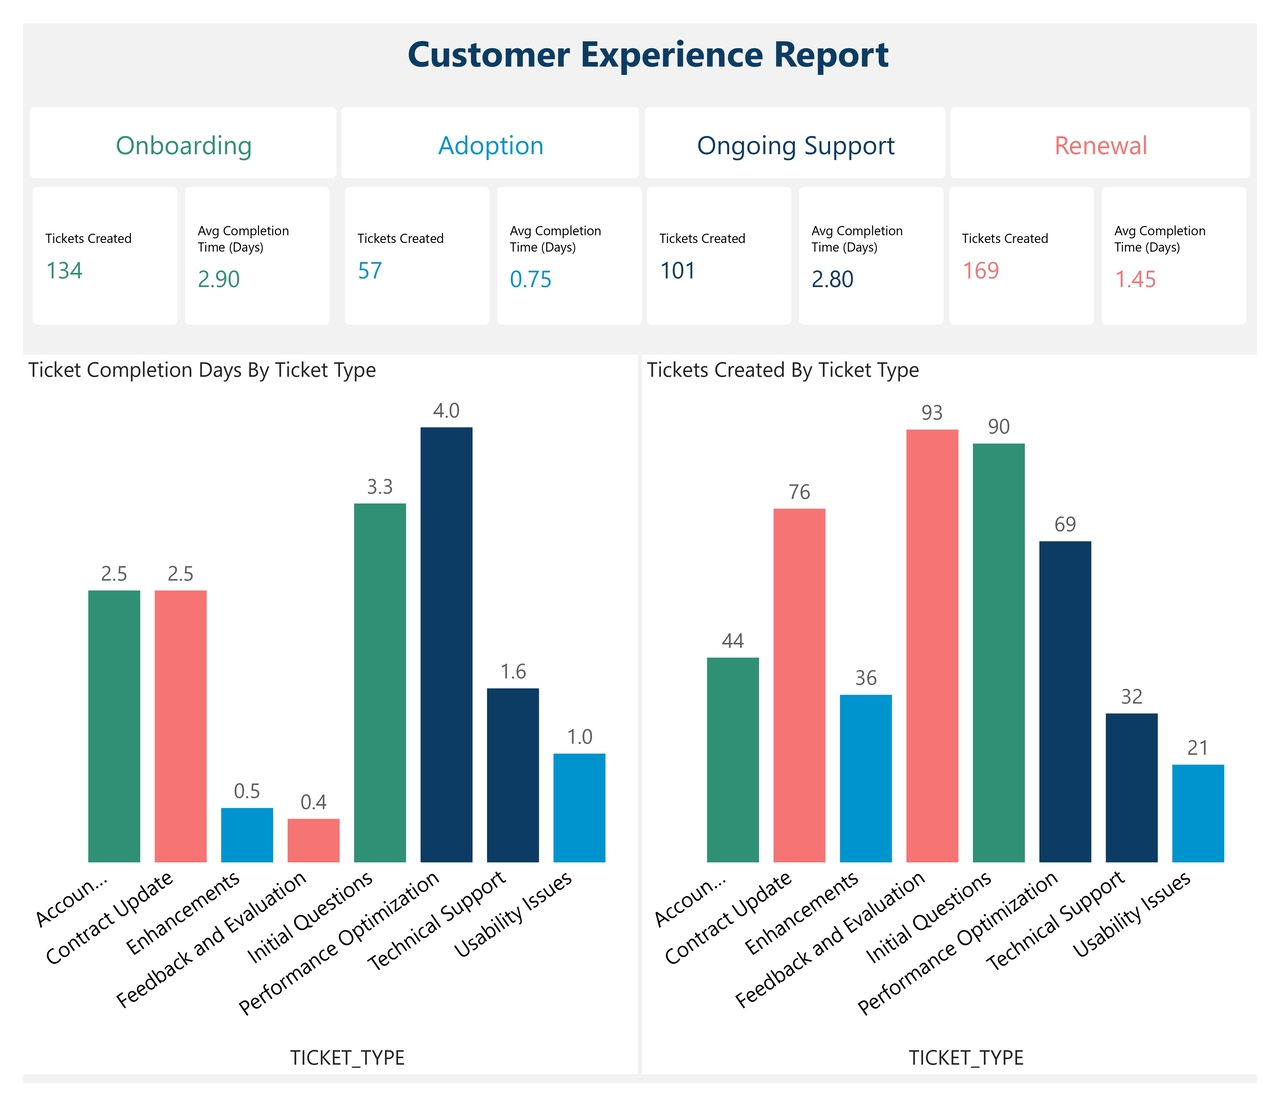
Customer Experience Report
The report works in the following way:
Data collection: It automatically pulls from the company’s ERPs the cases created by each customer and their completion times.
Data model: The report assigns each case to a single step during the customer journey. Then, it counts the cases created in every customer journey step and averages the time required to complete each case type.
Here is how you can use such a report:
Overview of cases volumes during the customer journey: This report displays the four customer journey steps at the top. In this example of a software firm, the customer journey steps are:
Onboarding -> Adoption -> Ongoing Support -> Renewal.
Under each step, the chart shows the number of tickets opened in the past, the types of these tickets, and their average completion times.
Identify customer experience bottlenecks: During the Ongoing Support phase, clients created the most tickets — 123, which is significantly more than in the other steps. These tickets also take an average of 2.55 days to complete, which is considerably longer than the rest. This insight indicates potential bottlenecks during the support phase.
This analysis facilitated by Power BI and marketing analytics allowed the organization to allocate more personnel to assist clients during the support phase of the product, or create educational resources on how to use the software effectively.
Want faster, smarter insights from your data?
Book a quick 30-minute call to explore how I can support your organization’s goals.