Business Intelligence Solution to Identify Drivers of User Growth
You’re leading a digital product, such as a mobile app or a web platform, and there are fewer and fewer users logging in every day to use your product.
“How do I ignite user growth?”
This is the question that sits heavily on your shoulders.
Digital product analytics provide invaluable support in such situations, offering actionable strategies based on data-driven analysis.
However, many struggle with deriving insights from data:
“We’re having all this data, but how can we get insights out of it?”
If you’re also interested in becoming data-driven, here’s an example of a business intelligence solution helping you drive the daily active usage of your product, by segmenting users based on their engagement.
Daily Active Users (DAU) Report for User Engagement Segmentation
Segment the users based on how frequently they use the product every week:
New Users – users that login for the first time.
Current Users – engaged today and at least one other time in the prior 6 days.
Reactivated Users – come back after being inactive for 7-29 days.
Then, create an additional 3 user segments based on how many of users return to the product the following week:
New users retained – users that were new the week before and came back current week.
Current users retained – users that were active each of the past 2 weeks and came back current week.
Reactivated users retained – users that reactivated the week before and came back current week.
In total, you have 6 user segments, with each user being assigned to only one bucket every week.
- New users
- New users retained
- Current users
- Current users retained
- Reactivated users
- Reactivated users retained
Which of these segments contribute the most to user’s growth? The following report, created in Power BI, helps you answer this question.
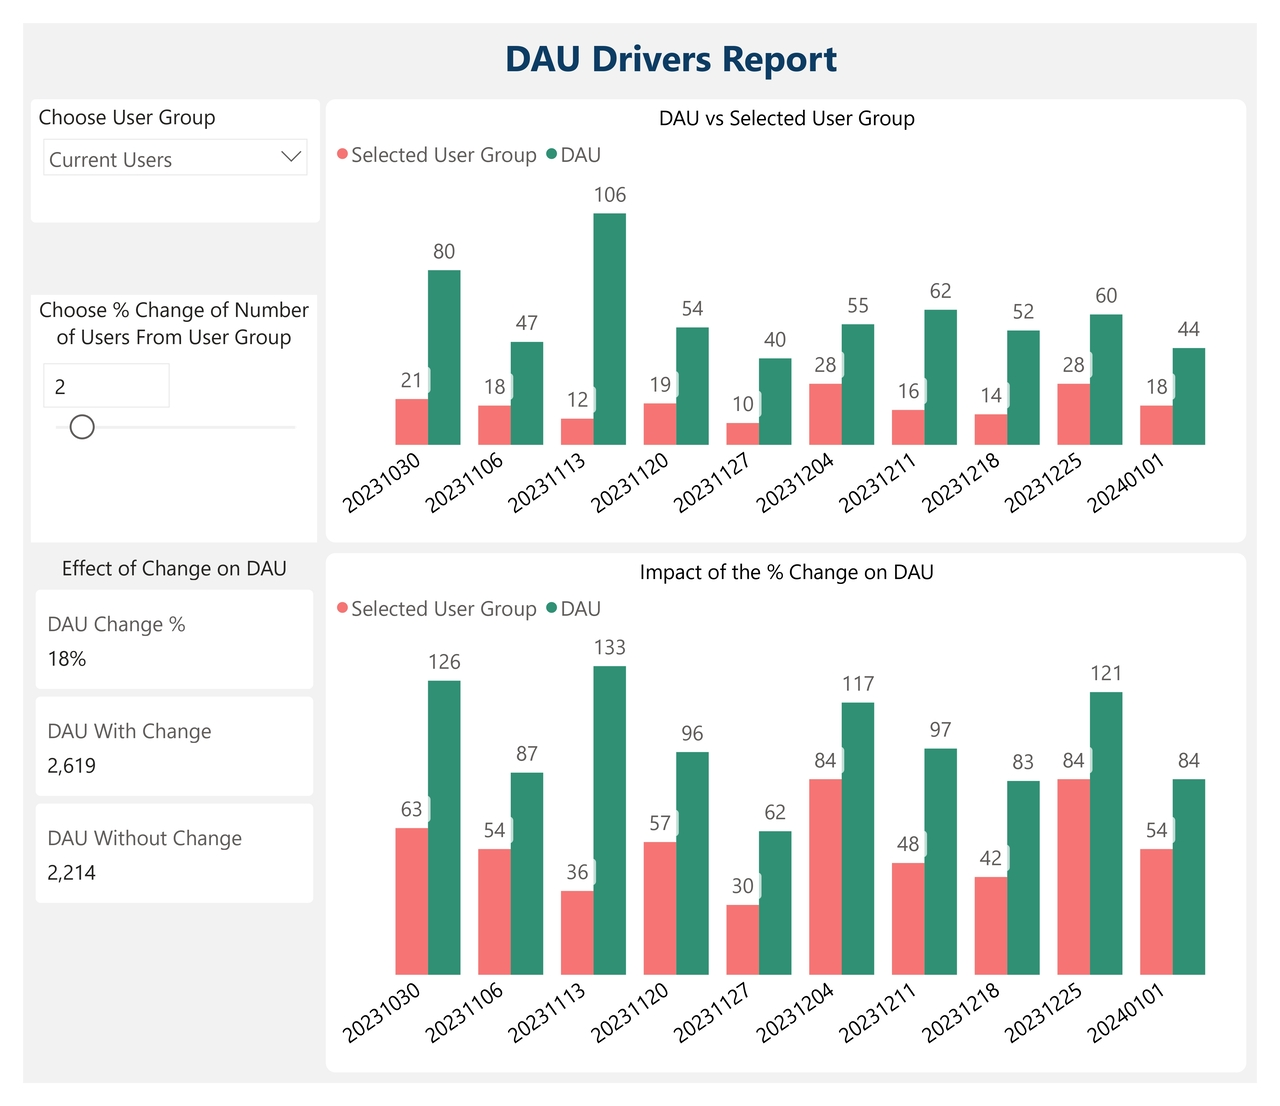
The DAU Drivers Report
The report works in the following way:
Data collection: The report pulls each user’s login days.
Data model: In the back-end, it calculates the 6 user segments and assigns each user to a single segment every week.
Here is how you can use such a report:
Compare user segments: Using the slicer from the top left, choose one segment. The default selection is Current Users. The top chart compares the number of users from the segment you chose (red bar) side by side with the total number of daily active users (green bar). In the first week, there are 80 daily active users and 21 current users.
Sensitivity Analysis: In the middle left part of the report there is a parameter allowing you to perform a sensitivity analysis. Adjusting the parameter simulates how an increase in the number of current users will affect the daily active users. The default selection is 2. If you move the slicer to 3, you simulate a 3% increase in the number of current users. The new number of current users is displayed in the bottom chart, side by side with the new number of daily active users.
Identify Key Drivers: Choosing different user segments and simulating how a % increase in those segments affects the daily active users (DAU) helps you determine which segment has the highest impact on growth:
An increase of 5% to new users causes a 19% growth.
An increase of 5% to current users causes a 45% growth.
An increase of 5% to reactivated users causes a 398% growth.
This analysis, facilitated by digital product analytics, allows you to set the strategic goal of reactivating as many users as quickly as possible after they become inactive. You can build campaigns tailored for them, knowing that reactivating users moves the needle and drives the highest growth.
Want faster, smarter insights from your data?
Book a quick 30-minute call to explore how I can support your organization’s goals.