Business Intelligence Solution to Optimize Inventory
Picture this: You’re browsing a shopping website and see your favourite gadget: a noise cancelling headset. Armed with impatience, you place the order. After a few days, you receive an email: “We’re sorry to inform you that the product is not in stock”.
What a disappointment!
Stock-outs and poor inventory management lead to customer dissatisfaction and poor cash flow management.
In an effort to optimize inventory, many finance professionals use data analytics. However, many struggle with deriving insights from data:
“I’m drowning in Excel!”
If you’re also interested in becoming data-driven, I’m showing you one practical business intelligence solution helping you make more informed decisions for inventory management and stock-outs prevention:
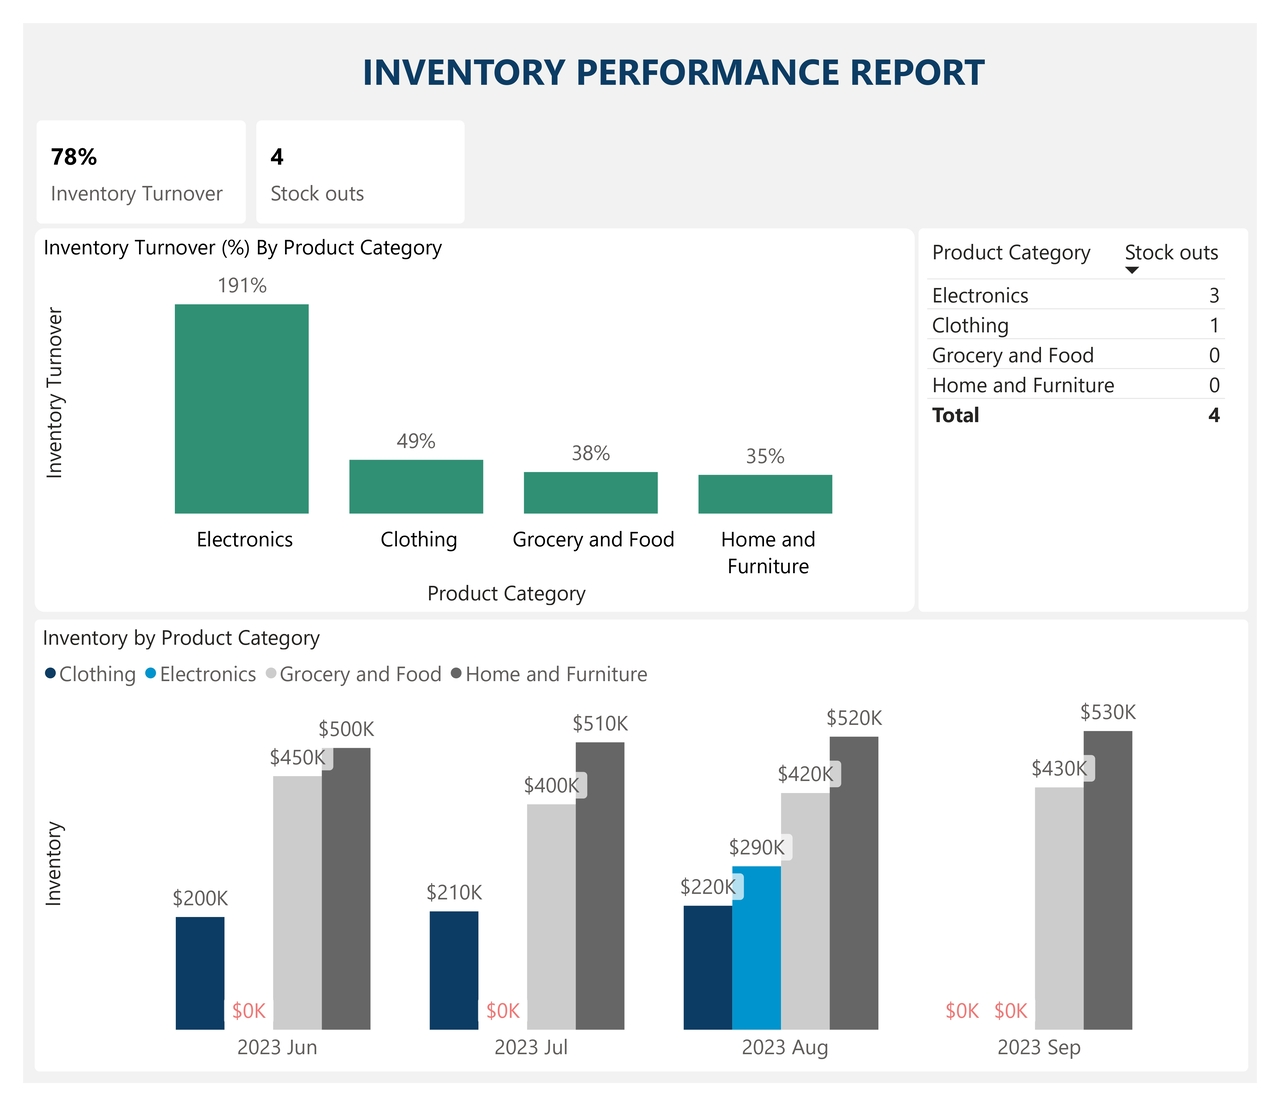
Inventory Performance Report
The report works in the following way:
Data collection: The report automatically pulls the following data from the ERPs: costs of goods sold, sales and stock levels for every product.
Data model: In the backend, it calculates the inventory levels for each product at every moment in time. It highlights the stock-out periods, as well as inventory turnover for different products.
Here is how you can use such a report:
- Overview: The cards display at a glance a total of 4 stock-outs and an overall turnover ratio of 78% across all product categories: electronics, clothing, grocery & food, and home & furniture.
- Identify overstocked or understocked products. The bar chart indicates product categories at risk of being overstocked or understocked by comparing turnover rates across product categories. In this dataset, electronics are understocked as they have a 191% turnover rate, significantly higher than the 78% average. For products with a high turnover ratio, consider increasing inventory to avoid losing sales. For products with a low turnover ratio, consider reducing inventory levels to decrease holding costs.
- Prevent stock-outs: The red points in the bottom chart highlight stock-out occurrences. In this dataset, there are 4 stock-outs during the 4-month period, marked by the $0k values in red. As a next step, you can increase safety stock levels or diversify suppliers for products with persistent stock-outs.
This analysis, facilitated by finance analytics and Power BI, allows finance leaders to optimize inventory levels:
- Increasing inventory for products with a high turnover ratio to avoid losing sales.
- For products with a low turnover ratio, reduce inventory levels to decrease holding costs.
- For products with persistent stock-outs, increase safety stock levels or diversify suppliers.
Want faster, smarter insights from your data?
Book a quick 30-minute call to explore how I can support your organization’s goals.