“I have all this data, how can I get insights out of it?”
Is a question I’m hearing often.
If you’re facing this challenge, business intelligence solutions can help you in so many ways!
Use Cases For Digital Product Leaders
-

Drop-Off Rate Report
Reduce drop-off-rate using this Power BI interactive report that segments the users based on their engagement and leverages digital product analytics.
-
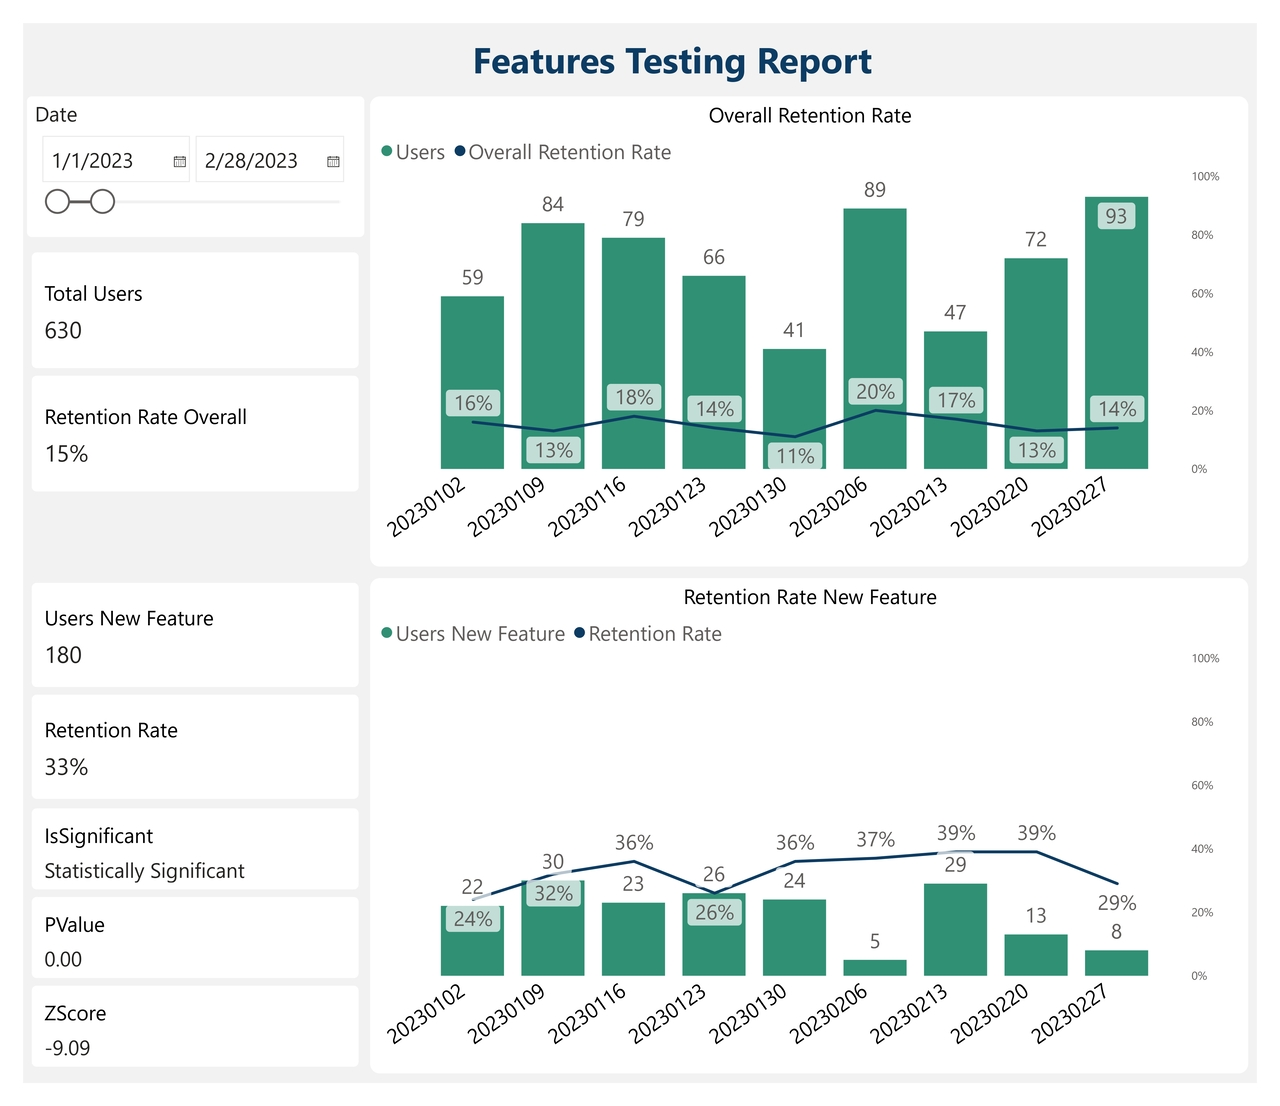
Features Testing Report
Decide which features to build by measuring the impact of different features on users’ retention rates using this report created in Power BI.
-
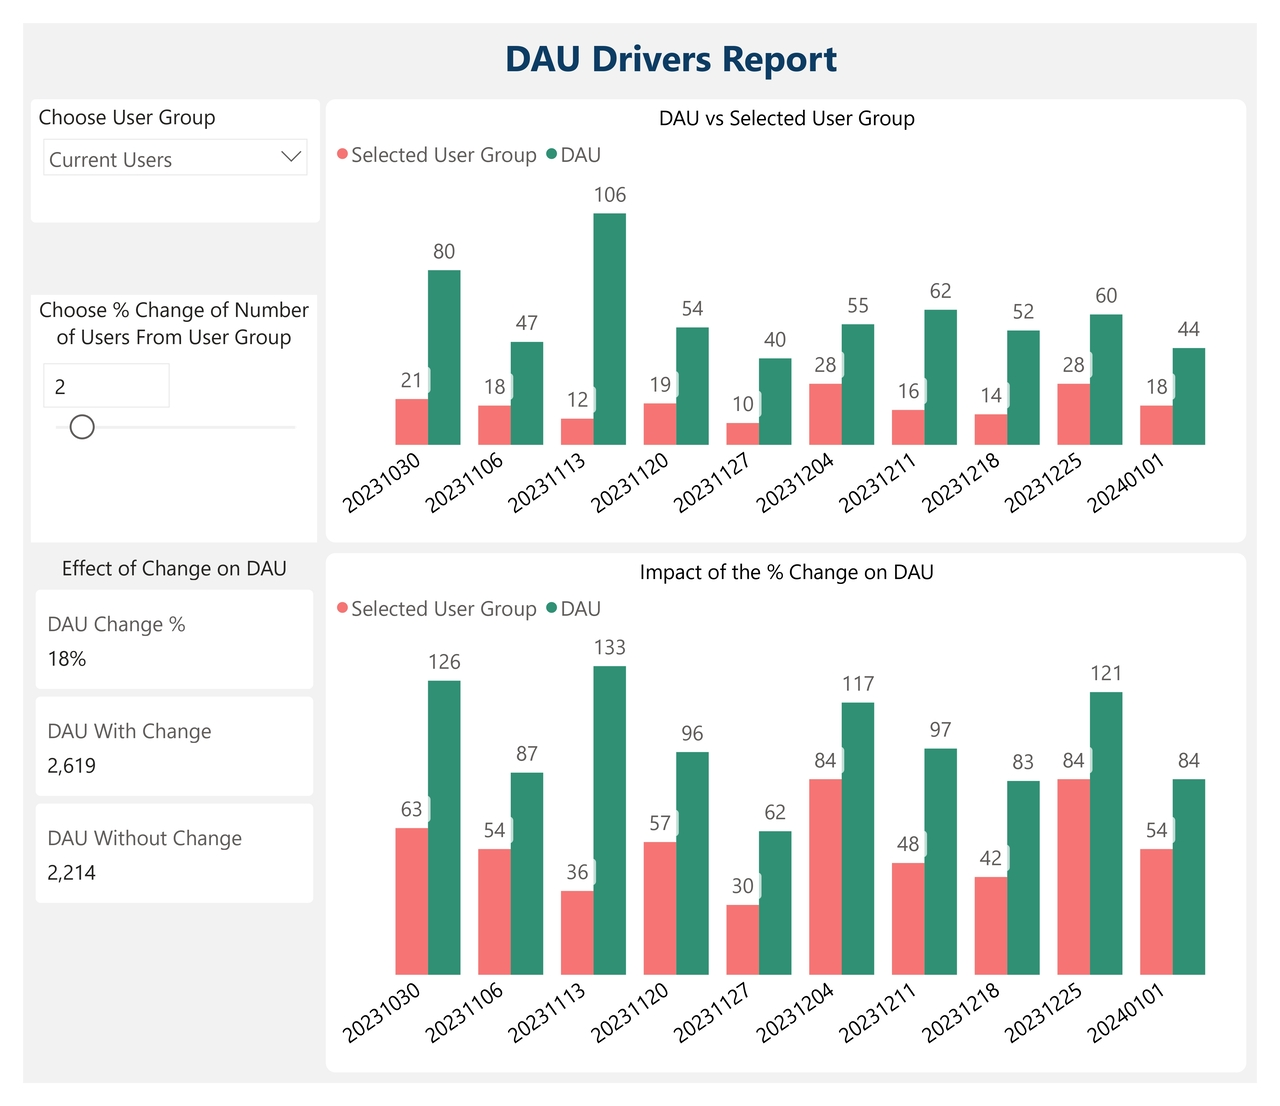
Daily Active Users (DAU) Drivers Report
Ignite user growth with this interactive report created in power bi that analyses the drivers of daily active users and leverages digital product analytics.
Use Cases For Marketing Leaders
-

Customer Lifetime Value (CLTV) Drivers Report
Discover how to boost customer lifetime value with our Power BI marketing analytics report, by identifying the key drivers with highest impact on revenue.
-
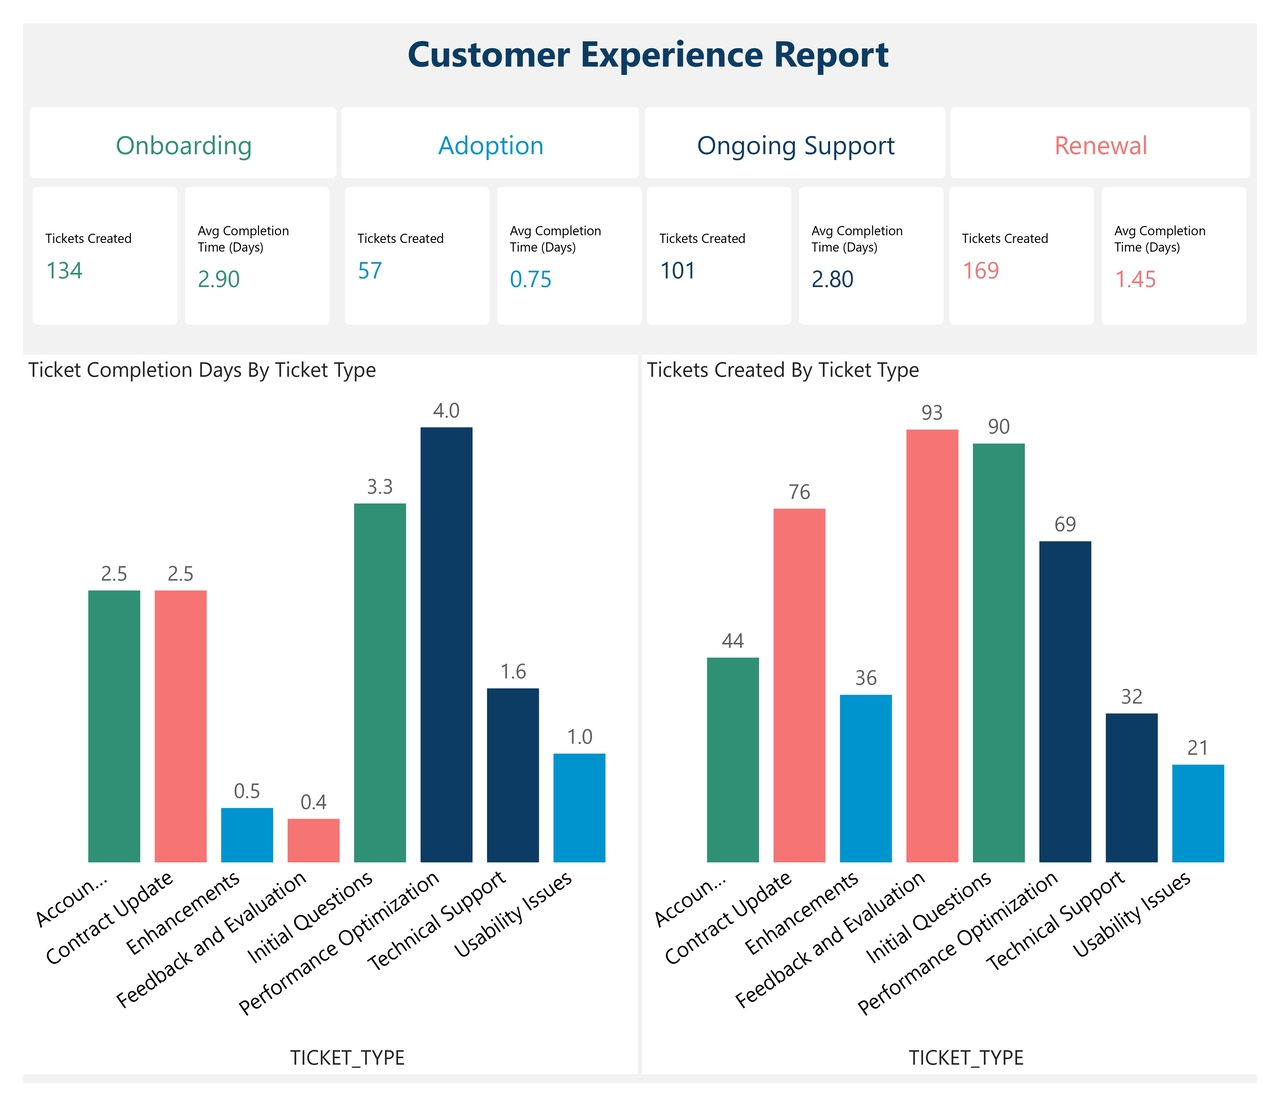
Customer Experience Report
Discover how to resolve bottlenecks at each step of the customer journey to enhance client satisfaction, using this Power BI marketing analytics report.
-
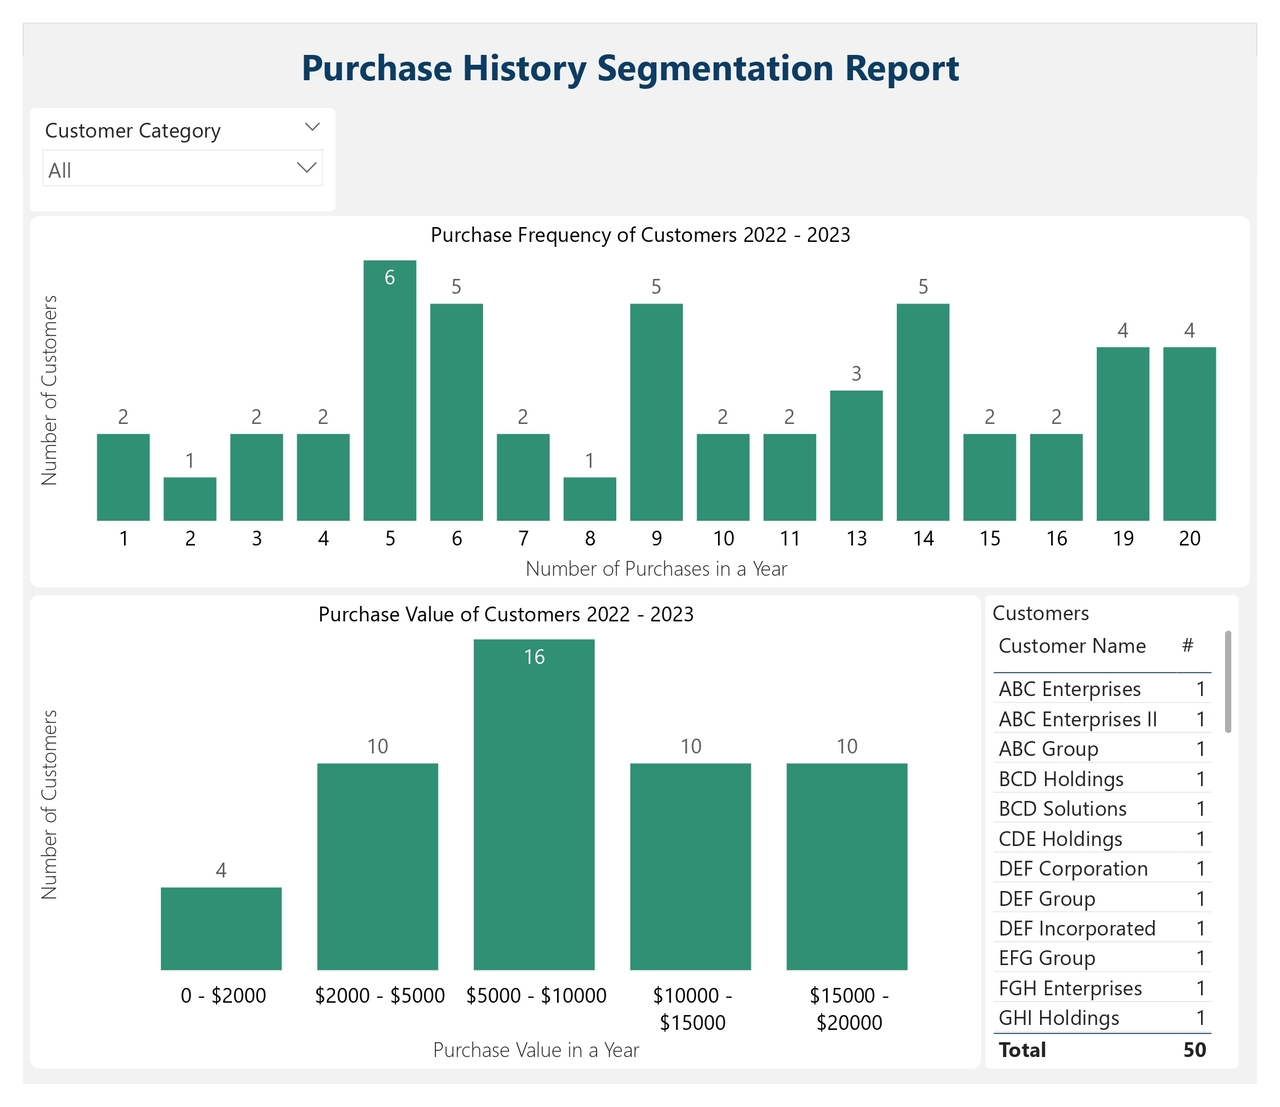
Purchase History Segmentation Report
Personalize Marketing Campaigns Using This Interactive Report Created In Power BI That Segments Clients Based on Purchase History.
Use Cases for Finance Leaders
-
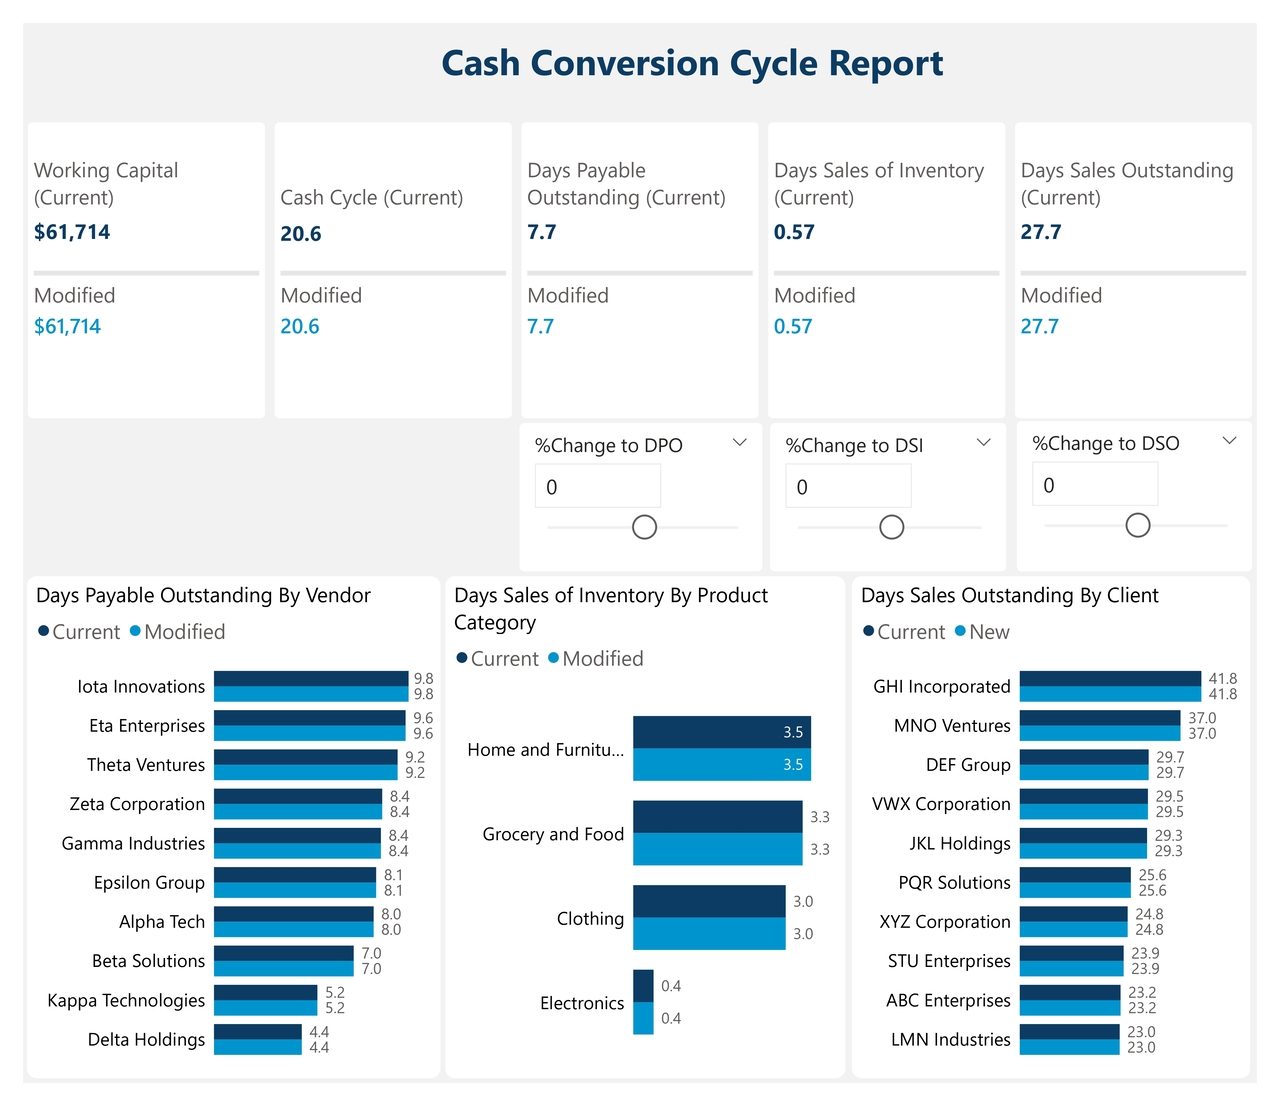
Cash Conversion Cycle Report
Optimize your cash conversion cycle with this interactive Power BI report, which allows you to conduct a sensitivity analysis to identify the biggest drivers of cash flow management.
-
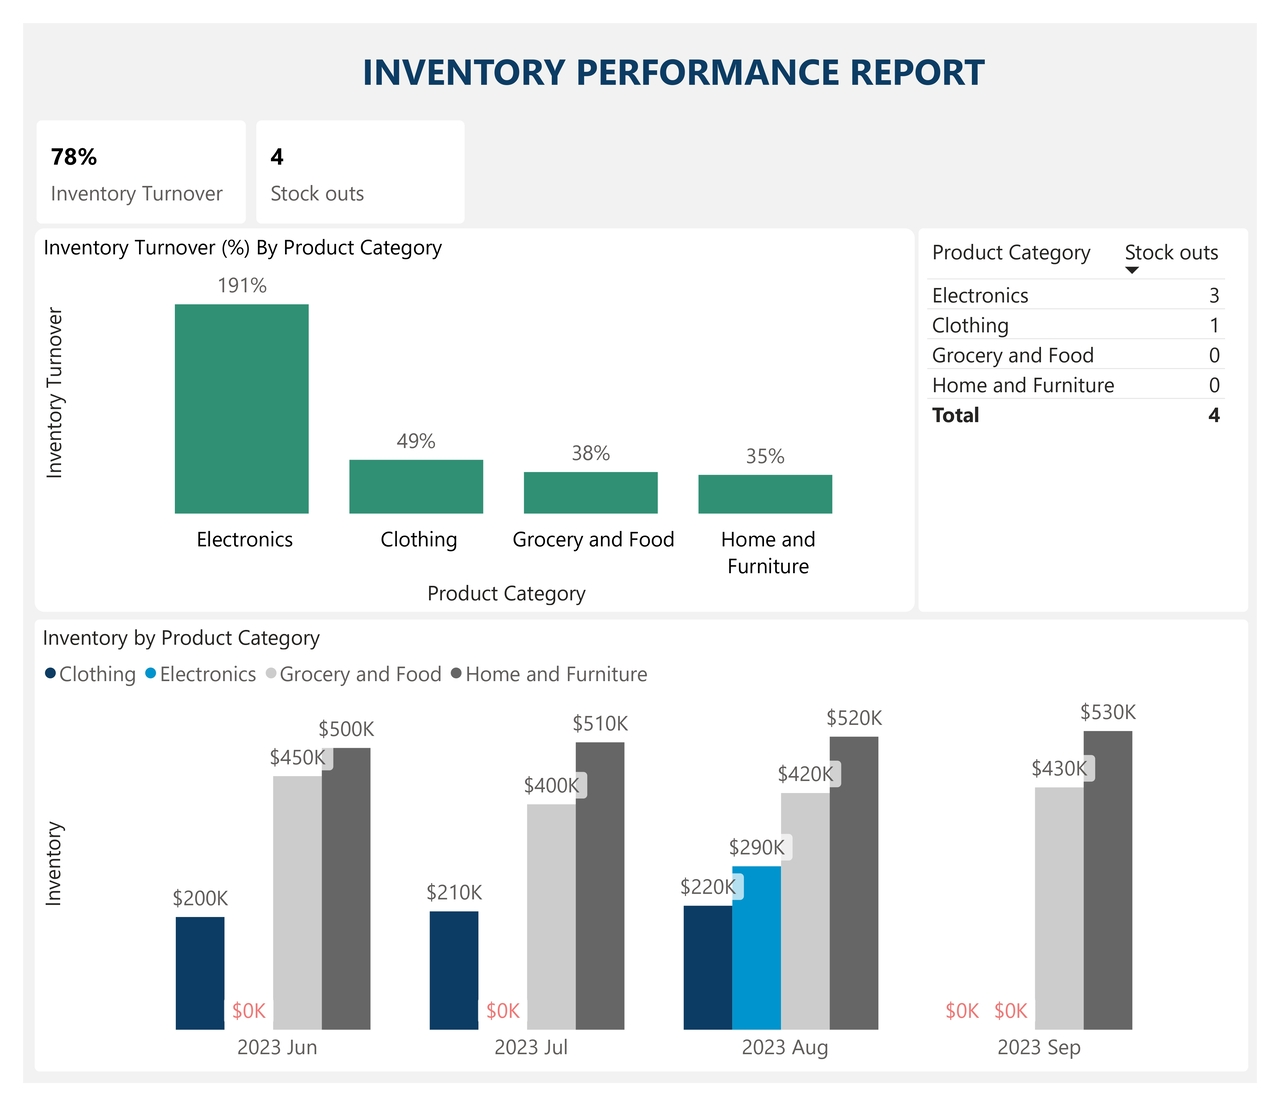
Inventory Performance Report
Reduce stock-outs and identify overstocked or understocked products using this Power BI report by analyzing inventory turn-over rates and stock-out instances.
-
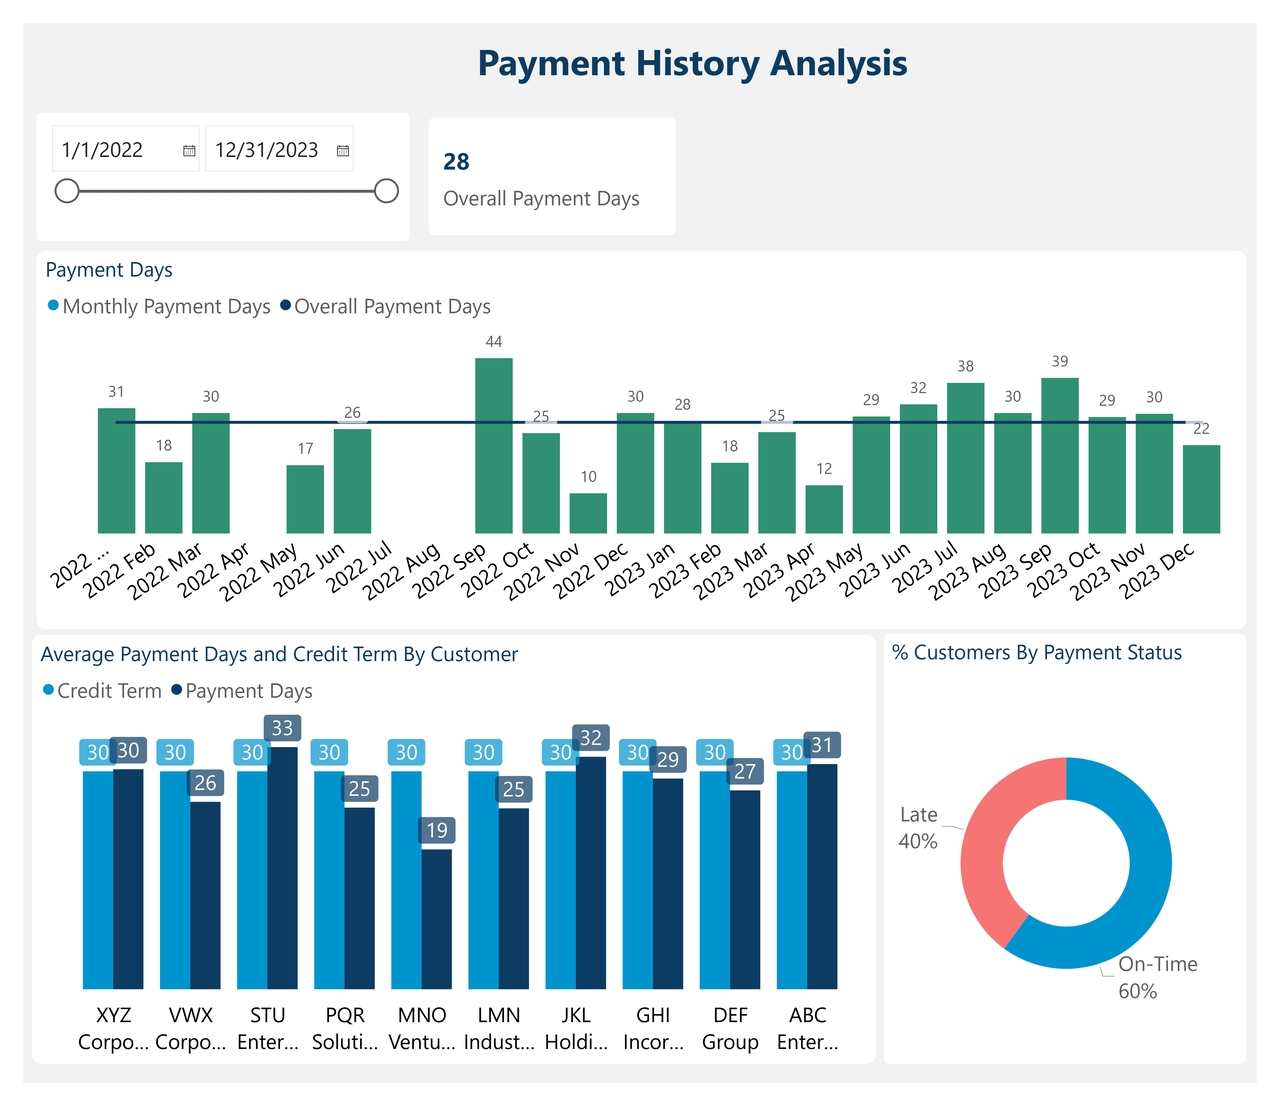
Payment History Analysis Report
Optimize Financial Planning Using This Interactive Cash Flow Report Created In Power BI That Reveals Customer Payment Trends.
Want faster, smarter insights from your data?
Book a quick 30-minute call to explore how I can support your organization’s goals.
